Chinese
- REPORT SUMMARY
- TABLE OF CONTENTS
-
Fischer Tropsch wax is a methylene polymer, an alkane polymer synthesized from hydrocarbon-based synthesis gas or natural gas. Fischer Tropsch wax is mainly composed of linear and saturated high-carbon alkanes with a relative molecular mass of 500-1000, which gives this chemical a fine crystal structure, high melting point, narrow melting point range, low oil content, and low penetration. It has the characteristics of high temperature, low mobility, low melt viscosity, hardness, wear resistance and high stability. With the rapid advancement of related science and technology, high melting point Fischer Tropsch wax can be made into products with a melting point of up to 129 degrees Celsius and a melting point range of only about 5 degrees Celsius, including crude wax and refined wax after modification. The product form is mainly Granules or powders. These characteristics of Fischer Tropsch wax determine its wide range of applications. At present, Fischer Tropsch wax is mainly used in the fields of PVC product processing lubricants, hot melt adhesives, plastic processing, inks and coatings.
Industry Overview
The world’s Fischer-Tropsch wax production companies are dominated by natural gas and coal. Due to the high cost of natural gas extraction in China, coal is the dominant energy source. Therefore, China’s production and processing of Fischer Tropsch wax is dominated by coal. Fischer Tropsch waxes are mainly divided into high-melting Fischer Tropsch waxes and medium-melting and low-melting Fischer Tropsch waxes. In 2020, the global Fischer Tropsch wax revenues are approximately 974.9 million US dollars, which is expected in 2026 to reach 1295 million dollars during 2021-2026, the annual compound growth rate of 7.4%.
Europe Fischer Tropsch Wax Production Situation: Industry Leader Accounted for Relatively Large, Other Regions Are Competing to Catch up with
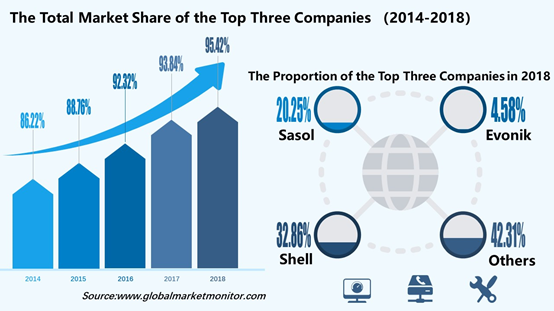
The main foreign manufacturers of Fischer-Tropsch wax include Shell from Dutch, South African Sasol and German Evonik. These three companies’ GTL plant to natural gas as raw material, the use of cobalt-based low temperature Fischer Tropsch synthesis process, the production of Fischer Tropsch wax product is better quality, foreign Fischer Tropsch wax total production capacity of 300,000 tons. The three companies market share in Europe accounted for Fischer Tropsch wax market 93.85%, almost formed a monopoly, in other Fischer Tropsch wax production companies account for just 6.15% market share.
Shell's Fischer Tropsch wax production facility in Malaysia is located in Bintulu, Sarawak State. After the expansion of the facility in 2012, the company’s wax production capacity is basically maintained at 100,000 tons/year, of which the high melting point Fischer Tropsch wax is 50,000 tons/year, and the medium and low melting point The wax production capacity is about 50,000 tons/year. In 2018, Shell exported approximately 10,000 tons of Fischer Tropsch wax to China.
Sasol Company mainly produces Fischer Tropsch wax products at the Sasol plant in South Africa. In 2018, the plant was expanded and the production capacity of Fischer Tropsch wax reached 200,000 tons/year. The output of Fischer Tropsch wax with high melting point is 100,000 tons per year, and the output of Fischer Tropsch wax with low melting point is 100,000 tons per year. Due to the increase in production, the price of Sasol's Fischer Tropsch wax products exported to China has been slightly lowered. The price of mainstream product H1 is about 12,000 yuan/ton. In 2018, Sasol's Fischer Tropsch wax exported to China was about 8,000 tons.
European Fischer Tropsch Wax Product Application Field: Wide Application, but has Different Focus Areas at Home and Abroad
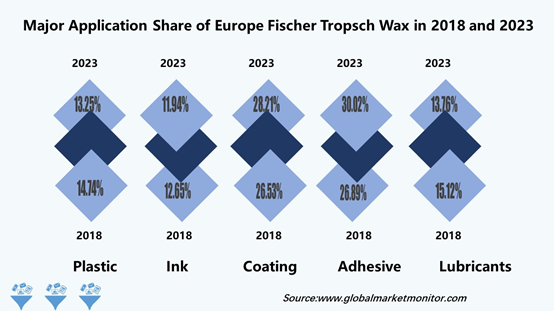
Fischer Tropsch wax applications include PVC plastic processing, candles, filling the mother particles, plastic processing, a small amount of application, hot melt adhesives, inks, coatings, tire rubber modified asphalts complex in industry and other areas for extension development. This year, the application demand of Fischer Tropsch wax in various fields has shown a steady growth trend.
It is worth noting that there are obvious differences between domestic and foreign application fields. In foreign countries, inks, coatings and adhesives are the main products. China's Fischer-Tropsch waxes are mainly used in plastics and other industries, and are mainly used for export. At present, the per capita consumption of plastics in the world is 40kg, and the per capita consumption of plastics in China is 46kg. Most of the per capita plastic consumption in developed countries in the world is more than 120 kilograms. Among them, Belgium has the most, up to 200 kilograms, followed by the United States, up to 170 kilograms. Therefore, the application prospect of Fischer Tropsch wax in my country is very broad in the future.
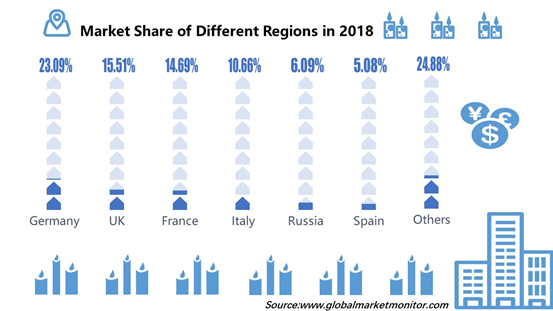
Regional Distribution of Fischer Tropsch Waxes in Europe: Concentrated Distribution and Developed Countries, Less Developed Countries have a Relatively Small Market Share
Europe Fischer Tropsch wax market mainly in Germany, Britain, France, Italy, Spain, Russia and other developed countries in Europe and some other relatively under-developed regions, including Germany, Britain, France are ahead of the development in 2018, and the top three companies respectively accounted for 24.16 %, 14.64 %, 14.37 %. In recent years, due to its high quality and good market environment, European Fischer Tropsch wax has a bright development prospect, and its sales volume and unit price have shown a straight upward trend. It can be seen that in the future era of industrialization, the market for Fischer Tropsch wax in Europe must bebooed continuously.
Future Development Trend: The High Melting Point Fischer Tropsch Wax Industry Has Become the Mainstream of the Industry, and Risks and Opportunities Coexist
According to incomplete statistics, the current world production and consumption of high melting point Fischer Tropsch synthetic wax may be more than 300,000 tons/year. Its application fields and market prospects are broad. The consumption of high-melting Fischer Tropsch synthetic waxes in my country is at the level of 100,000 tons, and the potential market demand continues to expand. If all the high melting point Fischer Tropsch waxes are produced domestically, the market potential will be released and the demand will be further expanded under the dual benefits of cost reduction and convenient supply. It can be expected that Fischer Tropsch wax has great potential for future development. Through market analysis, if domestic technology achieves a new break in the entire industrial chain of high melting point Fischer-Tropsch wax production, processing and product development, it can provide strong support for product upgrades in its application fields, which will help improve the performance of fine chemicals and plastics processing. Level. However, it cannot be ignored that although the applicable fields of Fischer Tropsch wax are very wide, the application of Fischer Tropsch wax in these fields has not been fully opened due to the undeveloped product series and the immature market cultivation. In particular, Fischer Tropsch wax is still facing the threat of substitutes such as paraffin wax, polyethylene wax and microcrystalline wax. At present, the practical application of Fischer Tropsch wax needs to be further explored.
For the Fischer Tropsch wax synthesis technology, domestically pay more attention to the characteristics of the oil that can be produced, and the high melting point Fischer Tropsch wax has received less attention. This is also one of the significant differences between the development of the Fischer Tropsch wax industry at home and abroad, especially for foreign companies. Pay attention to the development of high melting point Fischer Tropsch wax process. The high melting point Fischer Tropsch wax has a broad application field, a large potential demand, and a very promising development prospect. Practitioners in this industry should actively promote the industrialization of high melting point Fischer Tropsch wax production technology, and at the same time increase the degree of attention and support to product modification technology, serialized product development, market cultivation and other links, so as to realize this high added value as soon as possible The break of the entire product industry chain provides strong support and guarantee for the advancement of global fine chemicals and the upgrading and transformation of the global chemical industry.
Table of Contents
1 Report Overview
-
1.1 Product Definition and Scope
-
1.2 PEST (Political, Economic, Social and Technological) Analysis of Fischer Tropsch Wax Market
-
1.3 Market Segmentation by Type
-
1.3.1 Global Fischer Tropsch Wax Market Size and Growth Rate of C35-C80 Type from 2014 to 2026
-
1.3.2 Global Fischer Tropsch Wax Market Size and Growth Rate of C80-C100 Type from 2014 to 2026
-
1.3.3 Global Fischer Tropsch Wax Market Size and Growth Rate of C100+ Type from 2014 to 2026
-
1.4 Market Segmentation by End-Users
-
1.4.1 Global Fischer Tropsch Wax Market Size and Growth Rate of Adhesive Industry from 2014 to 2026
-
1.4.2 Global Fischer Tropsch Wax Market Size and Growth Rate of Ink from 2014 to 2026
-
1.4.3 Global Fischer Tropsch Wax Market Size and Growth Rate of Coating from 2014 to 2026
-
1.4.4 Global Fischer Tropsch Wax Market Size and Growth Rate of Polymer Processing from 2014 to 2026
-
1.4.5 Global Fischer Tropsch Wax Market Size and Growth Rate of Textiles from 2014 to 2026
-
1.4.6 Global Fischer Tropsch Wax Market Size and Growth Rate of Polishes from 2014 to 2026
-
1.4.7 Global Fischer Tropsch Wax Market Size and Growth Rate of Others from 2014 to 2026
-
1.5 Market Segmentation by Regions
-
1.5.1 North America Fischer Tropsch Wax Market Size and Growth Rate from 2014 to 2026
-
1.5.1.1 United States Fischer Tropsch Wax Market Size and Growth Rate from 2014 to 2026
-
1.5.1.2 Canada Fischer Tropsch Wax Market Size and Growth Rate from 2014 to 2026
-
1.5.1.3 Mexico Fischer Tropsch Wax Market Size and Growth Rate from 2014 to 2026
-
1.5.2 Europe Fischer Tropsch Wax Market Size and Growth Rate from 2014 to 2026
-
1.5.2.1 Germany Fischer Tropsch Wax Market Size and Growth Rate from 2014 to 2026
-
1.5.2.2 UK Fischer Tropsch Wax Market Size and Growth Rate from 2014 to 2026
-
1.5.2.3 France Fischer Tropsch Wax Market Size and Growth Rate from 2014 to 2026
-
1.5.2.4 Italy Fischer Tropsch Wax Market Size and Growth Rate from 2014 to 2026
-
1.5.2.5 Nordic Countries Fischer Tropsch Wax Market Size and Growth Rate from 2014 to 2026
-
1.5.2.6 Spain Fischer Tropsch Wax Market Size and Growth Rate from 2014 to 2026
-
1.5.2.7 Belgium Fischer Tropsch Wax Market Size and Growth Rate from 2014 to 2026
-
1.5.2.8 Poland Fischer Tropsch Wax Market Size and Growth Rate from 2014 to 2026
-
1.5.2.9 Russia Fischer Tropsch Wax Market Size and Growth Rate from 2014 to 2026
-
1.5.2.10 Turkey Fischer Tropsch Wax Market Size and Growth Rate from 2014 to 2026
-
1.5.3 Asia-Pacific Fischer Tropsch Wax Market Size and Growth Rate from 2014 to 2026
-
1.5.3.1 China Fischer Tropsch Wax Market Size and Growth Rate from 2014 to 2026
-
1.5.3.2 Japan Fischer Tropsch Wax Market Size and Growth Rate from 2014 to 2026
-
1.5.3.3 Australia and New Zealand Fischer Tropsch Wax Market Size and Growth Rate from 2014 to 2026
-
1.5.3.4 India Fischer Tropsch Wax Market Size and Growth Rate from 2014 to 2026
-
1.5.3.5 ASEAN Countries Fischer Tropsch Wax Market Size and Growth Rate from 2014 to 2026
-
1.5.3.6 South Korea Fischer Tropsch Wax Market Size and Growth Rate from 2014 to 2026
-
1.5.4 Latin America, Middle East & Africa Fischer Tropsch Wax Market Size and Growth Rate from 2014 to 2026
-
1.5.4.1 GCC Countries Fischer Tropsch Wax Market Size and Growth Rate from 2014 to 2026
-
1.5.4.2 Brazil Fischer Tropsch Wax Market Size and Growth Rate from 2014 to 2026
-
1.5.4.3 Nigeria Fischer Tropsch Wax Market Size and Growth Rate from 2014 to 2026
-
1.5.4.4 South Africa Fischer Tropsch Wax Market Size and Growth Rate from 2014 to 2026
-
1.5.4.5 Argentina Fischer Tropsch Wax Market Size and Growth Rate from 2014 to 2026
2 Market Trends and Competitive Landscape
-
2.1 Market Trends and Dynamics
-
2.1.1 Market Challenges and Restraints
-
2.1.2 Market Opportunities and Potentials
-
2.1.3 Mergers and Acquisitions
-
2.2 Competitive Landscape Analysis
-
2.2.1 Industrial Concentration Analysis
-
2.2.2 Porter's Five Forces Analysis of the Industry
-
2.2.3 SWOT Analysis for New Entrants
3 Segmentation of Fischer Tropsch Wax Market by Types
-
3.1 Product Development Trends of Different Types
-
3.2 Commercial Product Types of Major Vendors
-
3.3 Competitive Landscape Analysis of Different Types
-
3.4 Market Size of Fischer Tropsch Wax by Major Types
-
3.4.1 Fischer Tropsch Wax Market Size and Growth Rate of C35-C80 Type
-
3.4.2 Fischer Tropsch Wax Market Size and Growth Rate of C80-C100 Type
-
3.4.3 Fischer Tropsch Wax Market Size and Growth Rate of C100+ Type
4 Segmentation of Fischer Tropsch Wax Market by End-Users
-
4.1 Downstream Client Analysis by End-Users
-
4.2 Competitive Landscape Analysis of Different End-Users
-
4.3 Market Potential Analysis of Different End-Users
-
4.4 Market Size of Fischer Tropsch Wax by Major End-Users
-
4.4.1 Market Size and Growth Rate of Fischer Tropsch Wax in Adhesive Industry
-
4.4.2 Market Size and Growth Rate of Fischer Tropsch Wax in Ink
-
4.4.3 Market Size and Growth Rate of Fischer Tropsch Wax in Coating
-
4.4.4 Market Size and Growth Rate of Fischer Tropsch Wax in Polymer Processing
-
4.4.5 Market Size and Growth Rate of Fischer Tropsch Wax in Textiles
-
4.4.6 Market Size and Growth Rate of Fischer Tropsch Wax in Polishes
-
4.4.7 Market Size and Growth Rate of Fischer Tropsch Wax in Others
5 Market Analysis by Major Regions
-
5.1 Global Fischer Tropsch Wax Production Analysis by Major Regions
-
5.2 Global Fischer Tropsch Wax Consumption Analysis by Major Regions
-
5.3 Global Fischer Tropsch Wax Production, Import, Consumption and Export Analysis by Regions
-
5.3.1 North America Fischer Tropsch Wax Production, Import, Consumption and Export Analysis
-
5.3.2 Europe Fischer Tropsch Wax Production, Import, Consumption and Export Analysis
-
5.3.3 Asia Pacific Fischer Tropsch Wax Production, Import, Consumption and Export Analysis
-
5.3.4 Latin America, Middle East & Africa Fischer Tropsch Wax Production, Import, Consumption and Export Analysis
6 Product Commodity of Fischer Tropsch Wax Market in Major Countries
-
6.1 Top 5 Export Countries in Fischer Tropsch Wax market from 2014 to 2019
-
6.1.1 Top 5 Export Countries' Export Value Analysis in Fischer Tropsch Wax market from 2014 to 2019
-
6.1.2 Top 5 Export Countries' Export Volume Analysis in Fischer Tropsch Wax market from 2014 to 2019
-
6.2 Top 5 Import Countries in Fischer Tropsch Wax market from 2014 to 2019
-
6.2.1 Top 5 Import Countries' Import Value Analysis in Fischer Tropsch Wax market from 2014 to 2019
-
6.2.2 Top 5 Import Countries' Import Volume Analysis in Fischer Tropsch Wax market from 2014 to 2019
-
6.3 Emerging Top 3 Export Countries Analysis
-
6.4 Emerging Top 3 Import Countries Analysis
7 North America Fischer Tropsch Wax Landscape Analysis
-
7.1 North America Fischer Tropsch Wax Landscape Analysis by Major Types
-
7.2 North America Fischer Tropsch Wax Landscape Analysis by Major End-Users
-
7.3 North America Fischer Tropsch Wax Landscape Analysis by Major Countries
-
7.3.1 United States Fischer Tropsch Wax Market Volume and Growth Rate
-
7.3.2 Canada Fischer Tropsch Wax Market Volume and Growth Rate
-
7.3.3 Mexico Fischer Tropsch Wax Market Volume and Growth Rate
8 Europe Fischer Tropsch Wax Landscape Analysis
-
8.1 Europe Fischer Tropsch Wax Landscape Analysis by Major Types
-
8.2 Europe Fischer Tropsch Wax Landscape Analysis by Major End-Users
-
8.3 Europe Fischer Tropsch Wax Landscape Analysis by Major Countries
-
8.3.1 Germany Fischer Tropsch Wax Market Volume and Growth Rate
-
8.3.2 UK Fischer Tropsch Wax Market Volume and Growth Rate
-
8.3.3 France Fischer Tropsch Wax Market Volume and Growth Rate
-
8.3.4 Italy Fischer Tropsch Wax Market Volume and Growth Rate
-
8.3.5 Nordic Countries Fischer Tropsch Wax Market Volume and Growth Rate
-
8.3.6 Spain Fischer Tropsch Wax Market Volume and Growth Rate
-
8.3.7 Belgium Fischer Tropsch Wax Market Volume and Growth Rate
-
8.3.8 Poland Fischer Tropsch Wax Market Volume and Growth Rate
-
8.3.9 Russia Fischer Tropsch Wax Market Volume and Growth Rate
-
8.3.10 Turkey Fischer Tropsch Wax Market Volume and Growth Rate
9 Asia Pacific Fischer Tropsch Wax Landscape Analysis
-
9.1 Asia Pacific Fischer Tropsch Wax Landscape Analysis by Major Types
-
9.2 Asia Pacific Fischer Tropsch Wax Landscape Analysis by Major End-Users
-
9.3 Asia Pacific Fischer Tropsch Wax Landscape Analysis by Major Countries
-
9.3.1 China Fischer Tropsch Wax Market Volume and Growth Rate
-
9.3.2 Japan Fischer Tropsch Wax Market Volume and Growth Rate
-
9.3.3 Australia and New Zealand Fischer Tropsch Wax Market Volume and Growth Rate
-
9.3.4 India Fischer Tropsch Wax Market Volume and Growth Rate
-
9.3.5 ASEAN Countries Fischer Tropsch Wax Market Volume and Growth Rate
-
9.3.6 South Korea Fischer Tropsch Wax Market Volume and Growth Rate
10 Latin America, Middle East & Africa Fischer Tropsch Wax Landscape Analysis
-
10.1 Latin America, Middle East & Africa Fischer Tropsch Wax Landscape Analysis by Major Types
-
10.2 Latin America, Middle East & Africa Fischer Tropsch Wax Landscape Analysis by Major End-Users
-
10.3 Latin America, Middle East & Africa Fischer Tropsch Wax Landscape Analysis by Major Countries
-
10.3.1 GCC Countries Fischer Tropsch Wax Market Volume and Growth Rate
-
10.3.2 Brazil Fischer Tropsch Wax Market Volume and Growth Rate
-
10.3.3 Nigeria Fischer Tropsch Wax Market Volume and Growth Rate
-
10.3.4 South Africa Fischer Tropsch Wax Market Volume and Growth Rate
-
10.3.5 Argentina Fischer Tropsch Wax Market Volume and Growth Rate
11 Major Players Profile
-
11.1 Shell
-
11.1.1 Shell Company Profile and Recent Development
-
11.1.2 Market Performance
-
11.1.3 Product and Service Introduction
-
11.2 Sasol
-
11.2.1 Sasol Company Profile and Recent Development
-
11.2.2 Market Performance
-
11.2.3 Product and Service Introduction
-
11.3 Nanyang Saier
-
11.3.1 Nanyang Saier Company Profile and Recent Development
-
11.3.2 Market Performance
-
11.3.3 Product and Service Introduction
12 Data Source and Research Methodology
The List of Tables and Figures (Totals 101 Figures and 134 Tables)
-
Figure Product Picture
-
Figure Fischer Tropsch Wax Market Size and Growth Rate of C35-C80 Type from 2014 to 2026
-
Figure Fischer Tropsch Wax Market Size and Growth Rate of C80-C100 Type from 2014 to 2026
-
Figure Fischer Tropsch Wax Market Size and Growth Rate of C100+ Type from 2014 to 2026
-
Figure Market Share by Type in 2014
-
Figure Market Share by Type in 2018
-
Figure Market Share by Type in 2026
-
Figure Global Fischer Tropsch Wax Market Size and Growth Rate of Adhesive Industry from 2014 to 2026
-
Figure Global Fischer Tropsch Wax Market Size and Growth Rate of Ink from 2014 to 2026
-
Figure Global Fischer Tropsch Wax Market Size and Growth Rate of Coating from 2014 to 2026
-
Figure Global Fischer Tropsch Wax Market Size and Growth Rate of Polymer Processing from 2014 to 2026
-
Figure Global Fischer Tropsch Wax Market Size and Growth Rate of Textiles from 2014 to 2026
-
Figure Global Fischer Tropsch Wax Market Size and Growth Rate of Polishes from 2014 to 2026
-
Figure Global Fischer Tropsch Wax Market Size and Growth Rate of Others from 2014 to 2026
-
Figure Market Share by End-User in 2014
-
Figure Market Share by End-User in 2018
-
Figure Market Share by End-User in 2026
-
Figure North America Fischer Tropsch Wax Consumption Market Size and Growth Rate from 2014 to 2026
-
Figure United States Fischer Tropsch Wax Consumption Market Size and Growth Rate from 2014 to 2026
-
Figure Canada Fischer Tropsch Wax Consumption Market Size and Growth Rate from 2014 to 2026
-
Figure Mexico Fischer Tropsch Wax Consumption Market Size and Growth Rate from 2014 to 2026
-
Figure Europe Fischer Tropsch Wax Consumption Market Size and Growth Rate from 2014 to 2026
-
Figure Germany Fischer Tropsch Wax Consumption Market Size and Growth Rate from 2014 to 2026
-
Figure UK Fischer Tropsch Wax Consumption Market Size and Growth Rate from 2014 to 2026
-
Figure France Fischer Tropsch Wax Consumption Market Size and Growth Rate from 2014 to 2026
-
Figure Italy Fischer Tropsch Wax Consumption Market Size and Growth Rate from 2014 to 2026
-
Figure Nordic Countries Fischer Tropsch Wax Consumption Market Size and Growth Rate from 2014 to 2026
-
Figure Spain Fischer Tropsch Wax Consumption Market Size and Growth Rate from 2014 to 2026
-
Figure Belgium Fischer Tropsch Wax Consumption Market Size and Growth Rate from 2014 to 2026
-
Figure Poland Fischer Tropsch Wax Consumption Market Size and Growth Rate from 2014 to 2026
-
Figure Russia Fischer Tropsch Wax Consumption Market Size and Growth Rate from 2014 to 2026
-
Figure Turkey Fischer Tropsch Wax Consumption Market Size and Growth Rate from 2014 to 2026
-
Figure Asia-Pacific Fischer Tropsch Wax Consumption Market Size and Growth Rate from 2014 to 2026
-
Figure China Fischer Tropsch Wax Consumption Market Size and Growth Rate from 2014 to 2026
-
Figure Japan Fischer Tropsch Wax Consumption Market Size and Growth Rate from 2014 to 2026
-
Figure Australia and New Zealand Fischer Tropsch Wax Consumption Market Size and Growth Rate from 2014 to 2026
-
Figure India Fischer Tropsch Wax Consumption Market Size and Growth Rate from 2014 to 2026
-
Figure ASEAN Countries Fischer Tropsch Wax Consumption Market Size and Growth Rate from 2014 to 2026
-
Figure South Korea Fischer Tropsch Wax Consumption Market Size and Growth Rate from 2014 to 2026
-
Figure Latin America, Middle East & Africa Fischer Tropsch Wax Consumption Market Size and Growth Rate from 2014 to 2026
-
Figure GCC Countries Fischer Tropsch Wax Consumption Market Size and Growth Rate from 2014 to 2026
-
Figure Brazil Fischer Tropsch Wax Consumption Market Size and Growth Rate from 2014 to 2026
-
Figure Nigeria Fischer Tropsch Wax Consumption Market Size and Growth Rate from 2014 to 2026
-
Figure South Africa Fischer Tropsch Wax Consumption Market Size and Growth Rate from 2014 to 2026
-
Figure Argentina Fischer Tropsch Wax Consumption Market Size and Growth Rate from 2014 to 2026
-
Figure Development Trends and Industry Dynamics of Fischer Tropsch Wax Industry
-
Figure Market Challenges and Restraints
-
Figure Market Opportunities and Potentials
-
Table Mergers and Acquisition
-
Figure Market Share of TOP 3 Players in 2018
-
Figure Market Share of TOP 5 Players in 2018
-
Figure Market Share of TOP 6 Players from 2014 to 2019
-
Figure Porter's Five Forces Analysis
-
Figure New Entrant SWOT Analysis
-
Table Specifications of Different Types of Fischer Tropsch Wax
-
Figure Development Trends of Different Types
-
Table Commercial Products Types of Major Vendors
-
Figure Competitive Landscape Analysis of Different Types
-
Table Consumption of Fischer Tropsch Wax by Different Types from 2014 to 2026
-
Table Consumption Share of Fischer Tropsch Wax by Different Types from 2014 to 2026
-
Figure Market Size and Growth Rate of C35-C80 Type
-
Figure Market Size and Growth Rate of C80-C100 Type
-
Figure Market Size and Growth Rate of C100+ Type
-
Table Downstream Client Analysis by End-Users
-
Figure Competitive Landscape Analysis of Different End-Users
-
Table Market Potential Analysis of Different End-Users
-
Table Consumption of Fischer Tropsch Wax by Different End-Users from 2014 to 2026
-
Table Consumption Share of Fischer Tropsch Wax by Different End-Users from 2014 to 2026
-
Figure Market Size and Growth Rate of Adhesive Industry
-
Figure Market Size and Growth Rate of Ink
-
Figure Market Size and Growth Rate of Coating
-
Figure Market Size and Growth Rate of Polymer Processing
-
Figure Market Size and Growth Rate of Textiles
-
Figure Market Size and Growth Rate of Polishes
-
Figure Market Size and Growth Rate of Others
-
Table Global Fischer Tropsch Wax Production by Major Regions
-
Table Global Fischer Tropsch Wax Production Share by Major Regions
-
Figure Global Fischer Tropsch Wax Production Share by Major Regions in 2014
-
Figure Global Fischer Tropsch Wax Production Share by Major Regions in 2018
-
Figure Global Fischer Tropsch Wax Production Share by Major Regions in 2026
-
Table Global Fischer Tropsch Wax Consumption by Major Regions
-
Table Global Fischer Tropsch Wax Consumption Share by Major Regions
-
Figure Global Fischer Tropsch Wax Consumption Share by Major Regions in 2014
-
Figure Global Fischer Tropsch Wax Consumption Share by Major Regions in 2018
-
Figure Global Fischer Tropsch Wax Consumption Share by Major Regions in 2026
-
Table North America Fischer Tropsch Wax Production, Import, Consumption and Export Analysis
-
Table Europe Fischer Tropsch Wax Production, Import, Consumption and Export Analysis
-
Table Asia Pacific Fischer Tropsch Wax Production, Import, Consumption and Export Analysis
-
Table Latin America, Middle East & Africa Fischer Tropsch Wax Production, Import, Consumption and Export Analysis
-
Table Top 5 Export Countries' Export Value Analysis in Fischer Tropsch Wax market from 2014 to 2019
-
Table Top 5 Export Countries' Export Volume Analysis in Fischer Tropsch Wax market from 2014 to 2019
-
Table Top 5 Import Countries' Import Value Analysis in Fischer Tropsch Wax market from 2014 to 2019
-
Table Top 5 Import Countries' Import Volume Analysis in Fischer Tropsch Wax market from 2014 to 2019
-
Figure Emerging Top 3 Export Countries Analysis
-
Figure Emerging Top 3 Import Countries Analysis
-
Table North America Fischer Tropsch Wax Consumption by Types from 2014 to 2026
-
Table North America Fischer Tropsch Wax Consumption Share by Types from 2014 to 2026
-
Figure North America Fischer Tropsch Wax Consumption Share by Types in 2014
-
Figure North America Fischer Tropsch Wax Consumption Share by Types in 2018
-
Figure North America Fischer Tropsch Wax Consumption Share by Types in 2026
-
Table North America Fischer Tropsch Wax Consumption by End-Users from 2014 to 2026
-
Table North America Fischer Tropsch Wax Consumption Share by End-Users from 2014 to 2026
-
Figure North America Fischer Tropsch Wax Consumption Share by End-Users in 2014
-
Figure North America Fischer Tropsch Wax Consumption Share by End-Users in 2018
-
Figure North America Fischer Tropsch Wax Consumption Share by End-Users in 2026
-
Table North America Fischer Tropsch Wax Consumption by Major Countries from 2014 to 2026
-
Table North America Fischer Tropsch Wax Consumption Share by Major Countries from 2014 to 2026
-
Figure North America Fischer Tropsch Wax Consumption Share by Major Countries in 2014
-
Figure North America Fischer Tropsch Wax Consumption Share by Major Countries in 2018
-
Figure North America Fischer Tropsch Wax Consumption Share by Major Countries in 2026
-
Figure United States Fischer Tropsch Wax Market Volume and Growth Rate from 2014 to 2026
-
Figure Canada Fischer Tropsch Wax Market Volume and Growth Rate from 2014 to 2026
-
Figure Mexico Fischer Tropsch Wax Market Volume and Growth Rate from 2014 to 2026
-
Table Europe Fischer Tropsch Wax Consumption by Types from 2014 to 2026
-
Table Europe Fischer Tropsch Wax Consumption Share by Types from 2014 to 2026
-
Figure Europe Fischer Tropsch Wax Consumption Share by Types in 2014
-
Figure Europe Fischer Tropsch Wax Consumption Share by Types in 2018
-
Figure Europe Fischer Tropsch Wax Consumption Share by Types in 2026
-
Table Europe Fischer Tropsch Wax Consumption by End-Users from 2014 to 2026
-
Table Europe Fischer Tropsch Wax Consumption Share by End-Users from 2014 to 2026
-
Figure Europe Fischer Tropsch Wax Consumption Share by End-Users in 2014
-
Figure Europe Fischer Tropsch Wax Consumption Share by End-Users in 2018
-
Figure Europe Fischer Tropsch Wax Consumption Share by End-Users in 2026
-
Table Europe Fischer Tropsch Wax Consumption by Major Countries from 2014 to 2026
-
Table Europe Fischer Tropsch Wax Consumption Share by Major Countries from 2014 to 2026
-
Figure Europe Fischer Tropsch Wax Consumption Share by Major Countries in 2014
-
Figure Europe Fischer Tropsch Wax Consumption Share by Major Countries in 2018
-
Figure Europe Fischer Tropsch Wax Consumption Share by Major Countries in 2026
-
Figure Germany Fischer Tropsch Wax Market Volume and Growth Rate from 2014 to 2026
-
Figure UK Fischer Tropsch Wax Market Volume and Growth Rate from 2014 to 2026
-
Figure France Fischer Tropsch Wax Market Volume and Growth Rate from 2014 to 2026
-
Figure Italy Fischer Tropsch Wax Market Volume and Growth Rate from 2014 to 2026
-
Figure Nordic Countries Fischer Tropsch Wax Market Volume and Growth Rate from 2014 to 2026
-
Figure Belgium Fischer Tropsch Wax Market Volume and Growth Rate from 2014 to 2026
-
Figure Poland Fischer Tropsch Wax Market Volume and Growth Rate from 2014 to 2026
-
Figure Russia Fischer Tropsch Wax Market Volume and Growth Rate from 2014 to 2026
-
Figure Turkey Fischer Tropsch Wax Market Volume and Growth Rate from 2014 to 2026
-
Table Asia Pacific Fischer Tropsch Wax Consumption by Types from 2014 to 2026
-
Table Asia Pacific Fischer Tropsch Wax Consumption Share by Types from 2014 to 2026
-
Figure Asia Pacific Fischer Tropsch Wax Consumption Share by Types in 2014
-
Figure Asia Pacific Fischer Tropsch Wax Consumption Share by Types in 2018
-
Figure Asia Pacific Fischer Tropsch Wax Consumption Share by Types in 2026
-
Table Asia Pacific Fischer Tropsch Wax Consumption by End-Users from 2014 to 2026
-
Table Asia Pacific Fischer Tropsch Wax Consumption Share by End-Users from 2014 to 2026
-
Figure Asia Pacific Fischer Tropsch Wax Consumption Share by End-Users in 2014
-
Figure Asia Pacific Fischer Tropsch Wax Consumption Share by End-Users in 2018
-
Figure Asia Pacific Fischer Tropsch Wax Consumption Share by End-Users in 2026
-
Table Asia Pacific Fischer Tropsch Wax Consumption by Major Countries from 2014 to 2026
-
Table Asia Pacific Fischer Tropsch Wax Consumption Share by Major Countries from 2014 to 2026
-
Figure Asia Pacific Fischer Tropsch Wax Consumption Share by Major Countries in 2014
-
Figure Asia Pacific Fischer Tropsch Wax Consumption Share by Major Countries in 2018
-
Figure Asia Pacific Fischer Tropsch Wax Consumption Share by Major Countries in 2026
-
Figure China Fischer Tropsch Wax Market Volume and Growth Rate from 2014 to 2026
-
Figure Japan Fischer Tropsch Wax Market Volume and Growth Rate from 2014 to 2026
-
Figure Australia and New ZealandFischer Tropsch Wax Market Volume and Growth Rate from 2014 to 2026
-
Figure India Fischer Tropsch Wax Market Volume and Growth Rate from 2014 to 2026
-
Figure ASEAN Countries Fischer Tropsch Wax Market Volume and Growth Rate from 2014 to 2026
-
Figure South Korea Fischer Tropsch Wax Market Volume and Growth Rate from 2014 to 2026
-
Table Latin America, Middle East & Africa Fischer Tropsch Wax Consumption by Types from 2014 to 2026
-
Table Latin America, Middle East & Africa Fischer Tropsch Wax Consumption Share by Types from 2014 to 2026
-
Figure Latin America, Middle East & Africa Fischer Tropsch Wax Consumption Share by Types in 2014
-
Figure Latin America, Middle East & Africa Fischer Tropsch Wax Consumption Share by Types in 2018
-
Figure Latin America, Middle East & Africa Fischer Tropsch Wax Consumption Share by Types in 2026
-
Table Latin America, Middle East & Africa Fischer Tropsch Wax Consumption by End-Users from 2014 to 2026
-
Table Latin America, Middle East & Africa Fischer Tropsch Wax Consumption Share by End-Users from 2014 to 2026
-
Figure Latin America, Middle East & Africa Fischer Tropsch Wax Consumption Share by End-Users in 2014
-
Figure Latin America, Middle East & Africa Fischer Tropsch Wax Consumption Share by End-Users in 2018
-
Figure Latin America, Middle East & Africa Fischer Tropsch Wax Consumption Share by End-Users in 2026
-
Table Latin America, Middle East & Africa Fischer Tropsch Wax Consumption by Major Countries from 2014 to 2026
-
Table Latin America, Middle East & Africa Fischer Tropsch Wax Consumption Share by Major Countries from 2014 to 2026
-
Figure Latin America, Middle East & Africa Fischer Tropsch Wax Consumption Share by Major Countries in 2014
-
Figure Latin America, Middle East & Africa Fischer Tropsch Wax Consumption Share by Major Countries in 2018
-
Figure Latin America, Middle East & Africa Fischer Tropsch Wax Consumption Share by Major Countries in 2026
-
Figure GCC Countries Fischer Tropsch Wax Market Volume and Growth Rate from 2014 to 2026
-
Figure Brazil Fischer Tropsch Wax Market Volume and Growth Rate from 2014 to 2026
-
Figure Nigeria Fischer Tropsch Wax Market Volume and Growth Rate from 2014 to 2026
-
Figure South Africa Fischer Tropsch Wax Market Volume and Growth Rate from 2014 to 2026
-
Figure Argentina Fischer Tropsch Wax Market Volume and Growth Rate from 2014 to 2026
-
Table Company Profile and Development Status of Shell
-
Table Sales, Revenue, Sales Price and Gross Margin Analysis of Shell
-
Figure Sales and Growth Rate Analysis of Shell
-
Figure Revenue and Market Share Analysis of Shell
-
Table Product and Service Introduction of Shell
-
Table Company Profile and Development Status of Sasol
-
Table Sales, Revenue, Sales Price and Gross Margin Analysis of Sasol
-
Figure Sales and Growth Rate Analysis of Sasol
-
Figure Revenue and Market Share Analysis of Sasol
-
Table Product and Service Introduction of Sasol
-
Table Company Profile and Development Status of Nanyang Saier
-
Table Sales, Revenue, Sales Price and Gross Margin Analysis of Nanyang Saier
-
Figure Sales and Growth Rate Analysis of Nanyang Saier
-
Figure Revenue and Market Share Analysis of Nanyang Saier
-
Table Product and Service Introduction of Nanyang Saier
-